Readers of my blog, know that I am a big baseball fan and now-retired player due to a bad-hop broken nose years ago. Golf is generally much safer. If you look back, you can see my blogs about juiced baseballs, Moneyball and baseball in Japan. I also write a lot about safety at chemical plants. So, here we go again…let’s talk about baseball data and safety.
This season there has been a lot of talk about foul balls striking and injuring fans and installing netting to protect fans. But, as process engineers, we know that we need to first consider the data before making any decisions. So, let’s get the data and discuss the best way for Major League Baseball to proceed.
Annette Choi and her team recently published, “We Watched 906 Foul Balls To Find Out Where The Most Dangerous Ones Land.” Their research gathered the following data points:
| Column | Description |
| matchup | The two teams that played |
| game_date | Date of the most foul-heavy day at each stadium |
| type_of_hit | Fly, grounder, line drive, pop up or batter hits self |
| exit_velocity | Recorded exit velocity of each hit — blank if not provided |
| predicted_zone | The zone we predicted the foul ball would land in by gauging angles |
| camera_zone | The zone that the foul ball landed in, confirmed by footage |
| used_zone | The zone used for analysis |
This data collection was no easy feat. The MLB does not keep this type of statistics, even though baseball is really a numbers game. The team watched the 10 most foul-ball-heavy games this season to gather their findings.
Armed with the baseball data, Choi and her team determined the ball parks with the most foul balls:
| MOST FOUL-HEAVY DAY | |||
| STADIUM AVERAGE NO. OF FOULS PER GAME | DATE | MATCHUP | NO. OF FOULS |
| Camden Yards* 57 | 4/20/19 | Baltimore Orioles vs. Minnesota Twins | 113 |
| PNC Park 57 | 6/1/19 | Pittsburgh Pirates vs. Milwaukee Brewers | 111 |
| Oakland Coliseum 53 | 6/2/19 | Oakland A’s vs. Houston Astros | 109 |
| T-Mobile Park 53 | 5/18/19 | Seattle Mariners vs. Minnesota Twins | 100 |
| Globe Life Park 55 | 5/3/19 | Texas Rangers vs. Toronto Blue Jays | 87 |
| Dodger Stadium 51 | 3/29/19 | Los Angeles Dodgers vs. Arizona Diamondbacks | 86 |
| Miller Park 55 | 5/4/19 | Milwaukee Brewers vs. New York Mets | 85 |
| Citizens Bank Park 53 | 4/27/19 | Philadelphia Phillies vs. Miami Marlins | 75 |
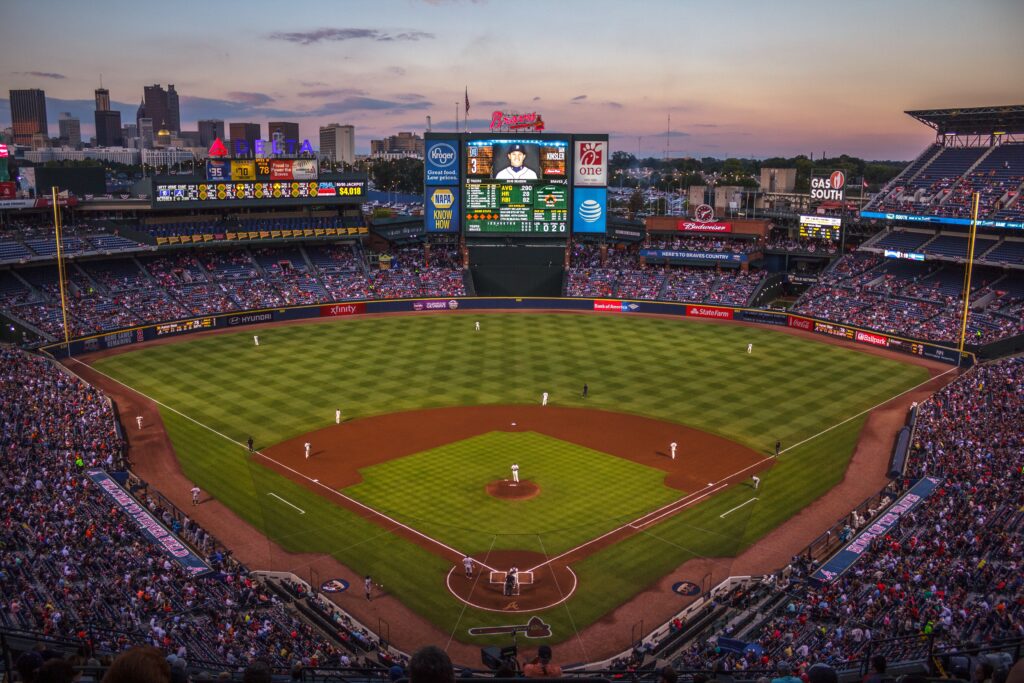
| SunTrust Park 53 | 4/14/19 | Atlanta Braves vs. New York Mets | 73 |
| Yankee Stadium 51 | 3/31/19 | New York Yankees vs. Baltimore Orioles | 67 |
The team then looked at netted versus non-netted areas as well as the ball velocities. Interestingly enough, they found that almost an equal number of balls went to each area but the balls with the highest velocities went into the unprotected areas.
Choi concludes, “Even with extensive netting, no one will ever be completely safe at a baseball game. But there are ways for MLB to protect its fans from foul balls — particularly in the most dangerous areas of the park.”
What I appreciate most is her observations are based in testing and learning about baseball data!
So, enjoy the World Series and root on your team and as Ernie Banks once said “It’s a beautiful day for a ballgame… Let’s play two!”